
D3 Hockey, Binary Search Trees and n Queens
December 2, 2015
It’s been a busy six or so weeks since the end of Dev Bootcamp, filled with networking, polishing up some old code, sending off job applications, starting a new project, more networking, delving deep into data structures and sort algorithms as if I were doing a CS major, still more networking, practicing the art of whiteboarding, and doing some things that I didn’t have time to do during Dev Bootcamp, such as communicating with the outside world.
In fact, it’s been so busy that I don’t really have the time at the present moment to write a full technical blog post with code samples and explanations. That will come sooner or later (I promise), but for now here’s a brief update on what I’ve been up to.
D3 Hockey
After Dev Bootcamp finished, I felt like a person who had just jumped off a treadmill that had been dialed up to sprint for nine straight weeks. I had this manic forward momentum and my legs were still churning, but there was no obvious place to run towards. My very talented friend and colleague Mat Liew (seriously, you should hire him) helped me solve this problem when he suggested working together on a project involving sport stats. I know what you might be thinking, but we didn’t set out to use the stats and our programming prowess to game the one-day fantasy sports leagues.
In fact, the stats were just an excuse to mess around with some cool web technologies—AngularJS and D3—that aren’t part of the Dev Bootcamp curriculum. About a week ago, we deployed our MVP (or Minimum Viable Product for those who are more familiar with the sports acronym), and we’ll probably continue to update it over the coming days and weeks. Here’s a brief description of the site and its purpose:
The last few years have seen the meteoric rise of advanced stats in hockey. Excellent sites like Puckalytics (which is the source of all the data included here) provide hockey enthusiasts with a wealth of information about the in-game performance of every NHL player beyond just gaudy numbers like goals and assists. But tables of data can be hard for the casual fan to make sense of. Our site tries to bridge this gap by presenting insightful subsets of data in graphical format that is maximally responsive.
Binary Search Trees
During the first week of onsite Dev Bootcamp, some rather exotic-sounding data structures were brought up in passing: graphs (not the D3 kind), a heap (which got me thinking about my all-time favorite author, Witold Gombrowicz, who uses the “heap” as a leitmotif throughout his works, but I’ve really digressed...), and even something called a red-black tree. As one of those dreaded “math people,” I couldn’t help but be intrigued by them and their theoretical (and practical) importance to computer science, so they went right to the top of my list of things (well, adjacently placed to sort algorithms) I wanted to dive into after the Dev Bootcamp thrash was over.
Former academic that I am, it felt quite good to crack open a physical textbook, place it to the right of me on my desk, and turn through the pages, translating all the described data structures into Ruby.
One of the great things about programming is that there isn’t just one “correct” way to do things, and, relative novice that I am, I still learn quite a bit from analyzing other people’s code. With that in mind, I decided to push up to GitHub my admittedly unpolished and not quite fully complete (there is no self-balancing mechanism) Ruby implementation of a Binary Search Tree, which hopefully might be found by someone who was in the same boat as me—eager to compare her Binary Search Tree class to another person’s, but frustrated at the lack of quality results that come up with a Google search (and hopefully she won’t feel the same way about my implementation!).
Whiteboarding and n Queens
Part of the rite of passage for a programmer looking to land his first (or second or third) job is something called whiteboarding. Basically, it’s like your recurring childhood nightmare of being called up to the chalkboard in math class and being asked a problem you have only the vaguest clue how to do and everyone is watching and if you don’t start writing soon the class will giggle at you. Only in this case, your chances of getting hired at company X largely depend on how well you can calmly talk through your logic, while coming up with a solution that isn’t objectively horrible.
Okay, I might as well admit that I always loved being called up to the chalkboard to solve math problems as a child, and that I’m also banking on my five years of experience of standing up in proximity to a whiteboard while teaching college students to stand me in good stead during any and all future technical interviews. But still.
Oh, and I should mention that whiteboarding reverses the common trope regarding public speaking that says “imagine them in their underwear.” In fact, you’re the one standing up there without the benefit of any fancy text editor that automatically lints (checks for syntax errors) for you, without the benefit of an interpreter for debugging, and without the benefit of Google for, well, any lacunae in your knowledge.
Anyway, I thought I should prepare my practicing solving the types of questions that are typically asked during these idiosyncratic technical interviews. I must say that the game-player and puzzle-solver in me really loved going through them. The very favorite problem I came across (and managed to solve—see my GitHub if curious) is apparently a classic programming brainteaser:
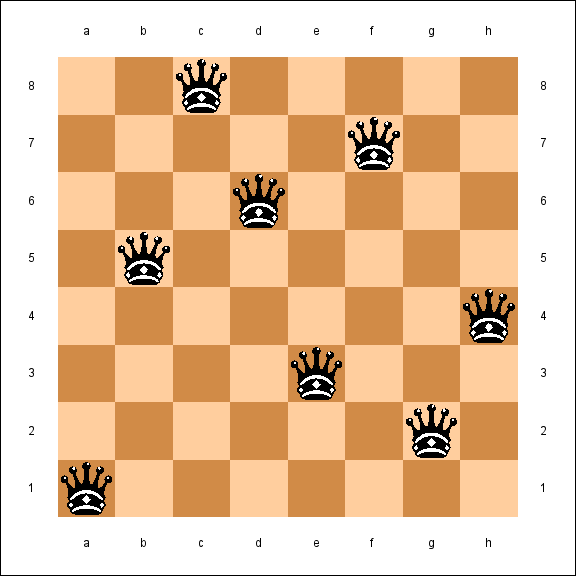
Determine every way to arrange n queens on an n x n sized chessboard such that none of the queens are attacking each other along a file, rank, or diagonal.
I won’t ruin the solution (at least in this post); rather, I encourage you (if you’re a programmer) to give it a try. I would suggest by starting by solving for a standard 8x8 chessboard with 8 queens and then abstracting out your algorithm from there.
That’s all from me for now, and good luck if you’re trying n queens!